
Our Air
The Air We Share Should Be Fair.
THE AIR YOU BREATHE SHOULDN’T BE A MYSTERY.
Every breath you take carries a story of wildfire smoke, industrial pollution, vehicle emissions, dust, ozone, chemicals, and climate extremes. But for most people, the quality of that air is completely invisible.
Fairness 4 our air changes that.
Using advanced visual intelligence from Tanzle.ai, Fairness 4 Our Air unifies real-time air-quality data into one transparent, accessible platform.
So every community — not just experts — can finally see what they’re breathing, what’s affecting them, and what needs to change.
THE PROBLEM WE’RE SOLVING
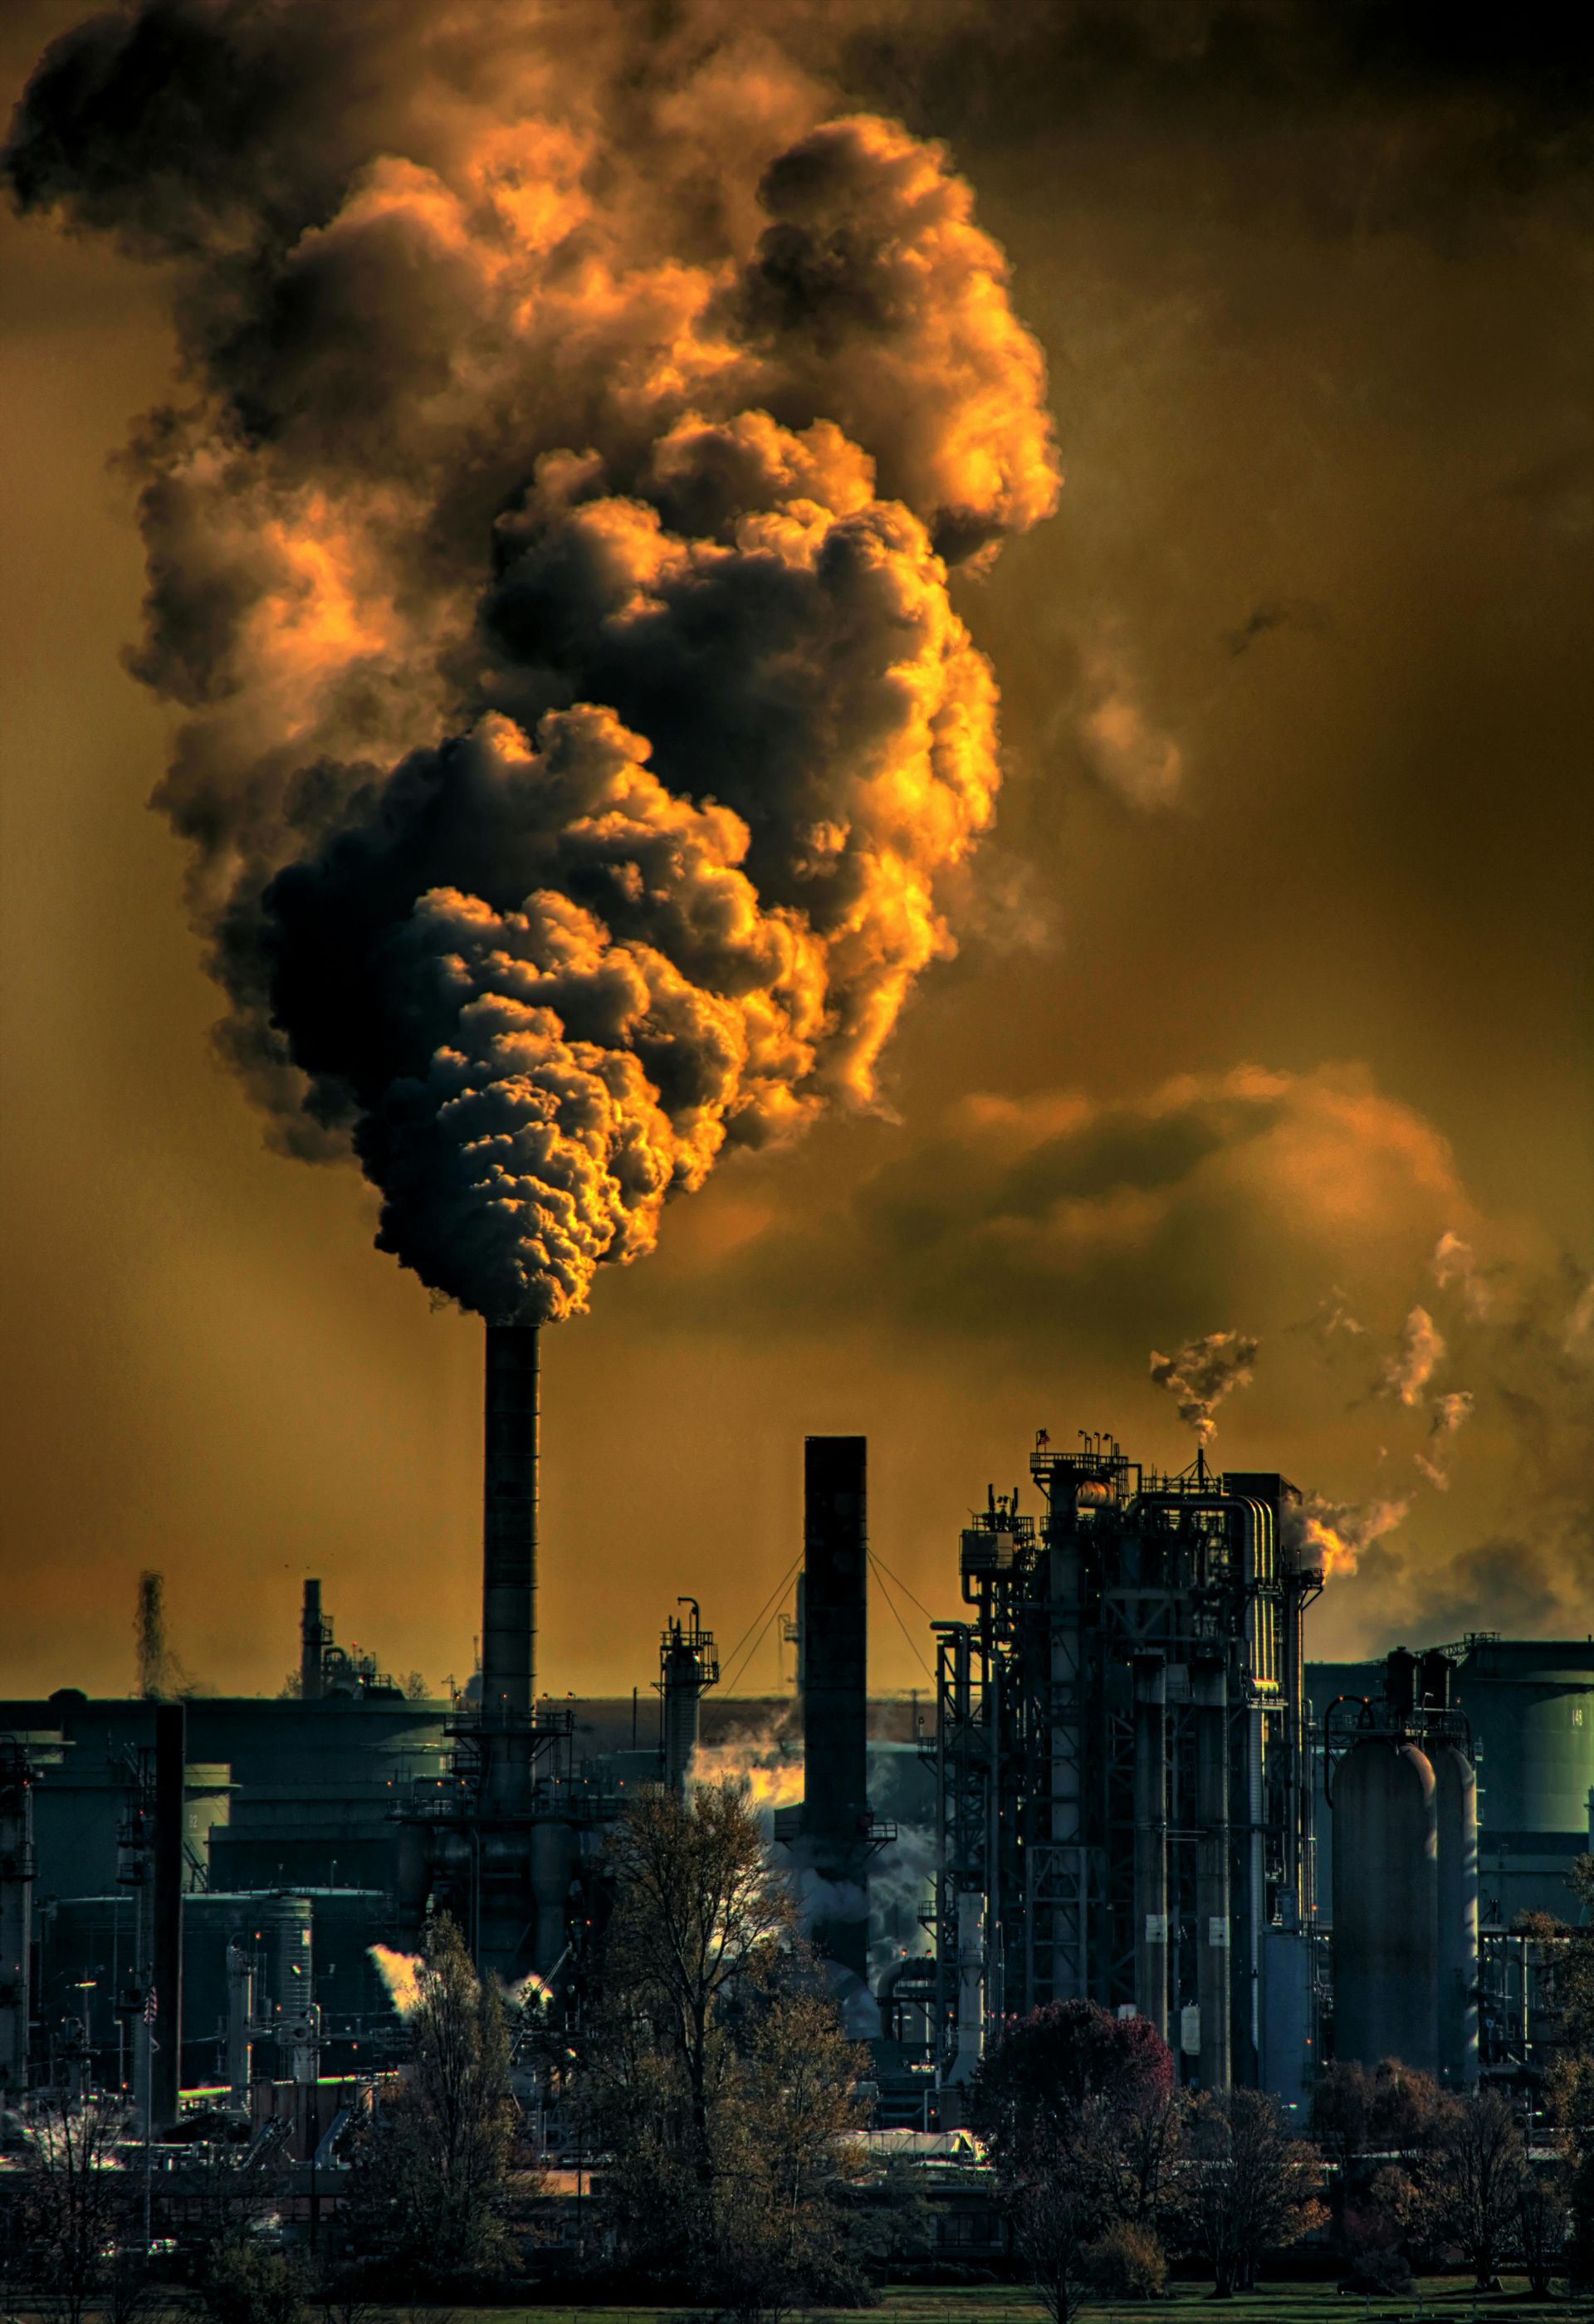
Air Pollution is Everywhere But Hidden.
Air today is shaped by:
- Wildfire smoke drifting across states
- PM2.5 & PM10 particles too small to see
- Vehicle corridor emissions
- Industrial and refinery pollution
- Agricultural burning and dust
- Ozone and nitrogen oxides
- Indoor VOCs and mold
- Drought-driven dust storms
- Chemical accidents or spills
People see none of this.
They see one number: the AQI (Air Quality Index).
But AQI alone doesn’t tell people:
- what they’re breathing
- where pollution comes from
- who is being harmed
- how long it will last
- what they should do next
Fairness 4 Our Air shows the full picture — simply, visually, and honestly.
WHAT FAIRNESS 4 AIR DOES
Fairness 4 Air Brings Unprecedented Clarity to the Air Around Us Indoors, Outdoors, Moment-by-Moment, Neighborhood-by-Neighborhood.
1. Unified Air Quality Dashboard
Fairness 4 Our Air integrates:
- EPA AirNow official monitors
- PurpleAir & low-cost sensor networks
- NASA & NOAA satellite data (smoke, PM, ozone)
- wildfire smoke models and projections
- industrial emissions (EPA TRI & state records)
- pollen and allergen indexes
- drought & dust indicators
- indoor AQI (optional building integrations)
- school & workplace sensors
- citizen reports and photos
All visualized in a single interactive system.
2. Wildfire Smoke Tracking (Real-Time + Forecast)
Fairness 4 Air shows:
- where smoke is right now
- how dense it is
- where it’s moving next
- how long it will last
- impacts on vulnerable groups
- live smoke-transport animations
- comparisons to past smoke seasons
In wildfire season, this is life-saving clarity.
3. Industrial Pollution & Emission Transparency
Communities can finally see:
- refinery emissions
- chemical plant output
- power plant pollution
- port & rail emissions
- particulate hotspots
- historically overburdened neighborhoods
- violations or exceedances
Fairness means pollution has nowhere to hide.
4. Health & Community Impact Mapping
Fairness 4 overlays environmental data with real-world health indicators:
- asthma prevalence
- respiratory ER visits
- school absenteeism
- heart and lung disease
- vulnerable population density
- age distribution
- environmental justice layers
This helps communities understand how pollution affects actual lives, not just charts.
5. Citizen Science Integration
Fairness 4 empowers citizens and community groups to contribute:
- local air sensor data
- photos of smoke, haze, or industrial plumes
- odor reports
- real-time neighborhood conditions
- school or indoor AQI readings
- environmental complaints
6. Hyperlocal Air Clarity (Down to Neighborhood Level)
Unlike static regional AQI, Fairness 4 visualizes air:
- by ZIP code
- by block or corridor
- by school district
- by tribal land
- by facility buffer zones
- by workplace location
Air doesn’t affect everyone equally.
Fairness 4 shows that clearly.
WHO USES FAIRNESS 4 AIR
Families & Individuals
- Know when air is unsafe
- Protect children, elders, and sensitive groups
- Make informed decisions about outdoor activity
- Understand long-term exposure risks
Schools & Childcare Centers
- Determine if outdoor recess is safe
- Monitor classroom AQI
- Adjust filtration and ventilation
- Protect students with asthma
Healthcare Systems & Public Health Leaders
- Track pollution-driven ER spikes
- Predict respiratory impacts
- Issue targeted health alerts
Emergency Managers & Government Leaders
- Plan responses during wildfire smoke events
- Identify vulnerable neighborhoods
- Allocate emergency resources equitably
- Communicate clearly with the public
Workers & Employers
- Protect outdoor workforce
- Ensure indoor air is filtered and safe
- Reduce liability through preventive action
Environmental Justice Organizations
- Expose inequitable pollution burdens
- Advocate for community-level change
- Hold polluters accountable
- Access real-time evidence
Researchers, Journalists & University Labs
- Analyze structured air data
- Visualize long-term exposure
- Communicate air stories with clarity
THE FAIRNESS DOCTRINE FOR AIR
Fairness 4 Our Air sets a new standard for how we tell the truth about what people are breathing.
Fairness 4 commits to:
- Transparency into pollutants, emissions, and exposure.
- Localized insight into air quality and health risks.
- Unbiased visibility into industrial, transportation, and wildfire impacts.
- Accountability for sources that degrade community health.
- Fair rights for every family to breathe clean, safe air.
Our doctrine is simple:
People deserve clean air.
Polluters must reveal truth.
Health demands both.
Fairness 4 Air elevates public safety with honest data and shared environmental accountability.
When air becomes transparent, excuses disappear.
When excuses disappear, action becomes unavoidable.
Fairness 4 Our Air is the doctrine that says: if you breathe it, you have a right to see it.
A Moment in Time
To Find Fairness 4 Our People Planet and Future.
Fairness isn’t about equality—it’s about balance.
With curiosity and a willingness to explore all perspectives, learn from the past, and make better decisions for today and tomorrow.